Results from November 2024 Panel Research
In November, a total of 145 UK Heritage Pulse panel members responded to at least one question in the survey. The first section of the survey asked respondents to reflect on April – September 2024 in comparison to last year. The following section was the third of an updated edition of “Pulse Monitor”, questions which track the individual and organisational resilience of respondents. These questions were previously asked quarterly, and as of September 2024, are now being put to the panel monthly.
Reflections on peak season 2024
The full data tables can be found in appendices to this report
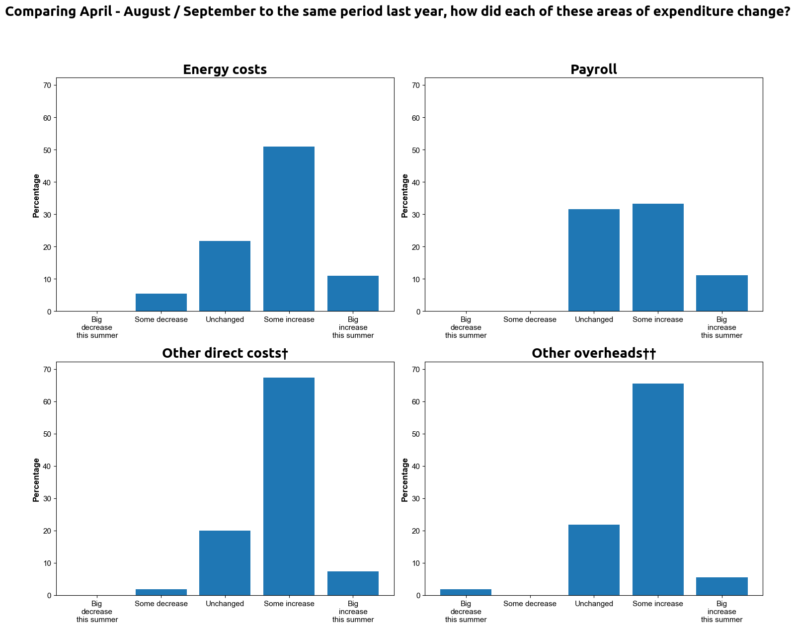
Costs are up less severely than this time last year, with early signs of payroll constraint
† Direct costs vary based on demand/activity like materials
†† Overheads are fixed costs like insurance, IT costs etc.
n=55
More than 60% of respondents reported increases in energy costs in this period compared to 2023. Over 70% of panel members reported increases in other direct costs and overheads.
Less than half of respondents reported increases in payroll, however, it should be noted that this period was before the tax changes announced in the recent Budget.
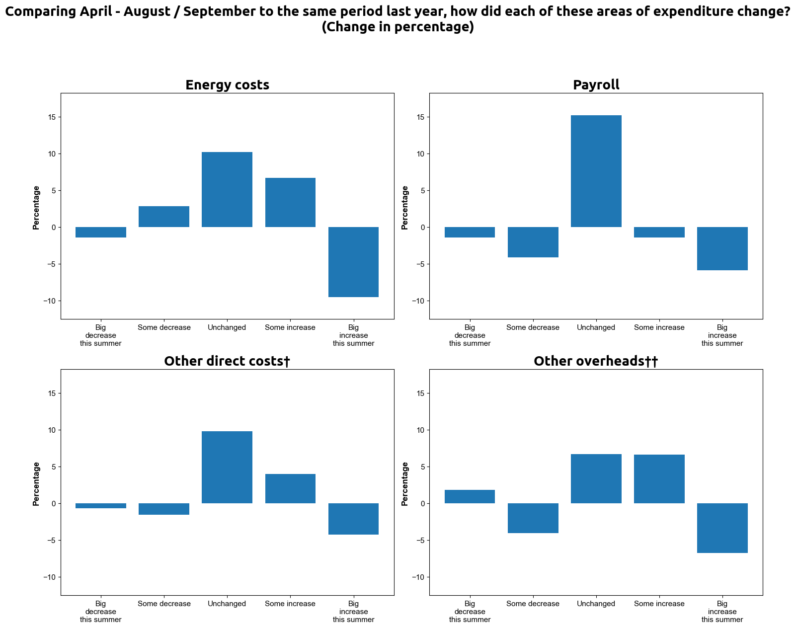
While 2024 contains a smaller sample, when compared with 2023 the panel members have seen fewer large increases in their costs. As highlighted in the chart below showing the percentage changes year-on-year, the number of organisations recording that payroll is “unchanged” has risen 15%, an indication that wages are at standstill for some.
† Direct costs vary based on demand/activity like materials
†† Overheads are fixed costs like insurance, IT costs etc.
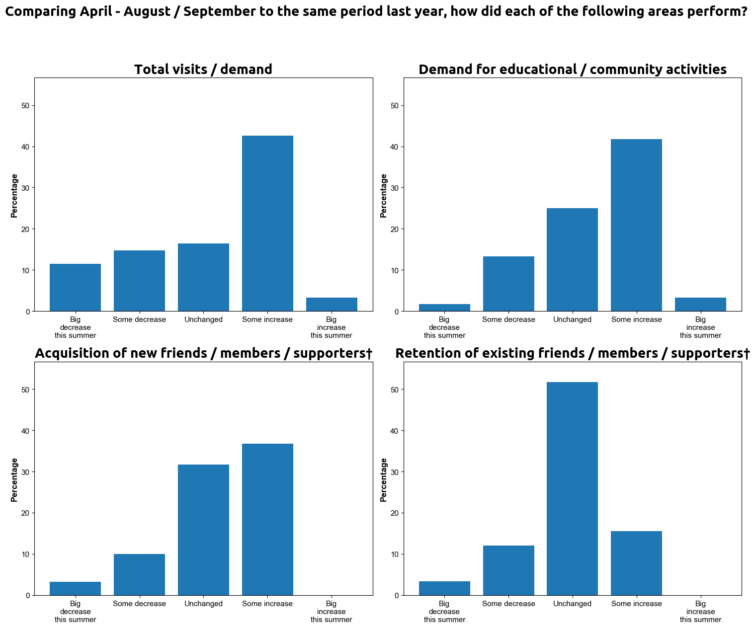
Positive indicators that visits and demand for community activities are growing
46% of panel members reported an increase in total visits / demand, with 45% observing an increase in total earned income. This closely matches the result from 2023 (41% reporting an increase in total visits / demand, 47% observing an increase in total earned income).
† Include annual pass-holders and other season ticket-holders if these are advertised as a way of supporting your work.
n = 61
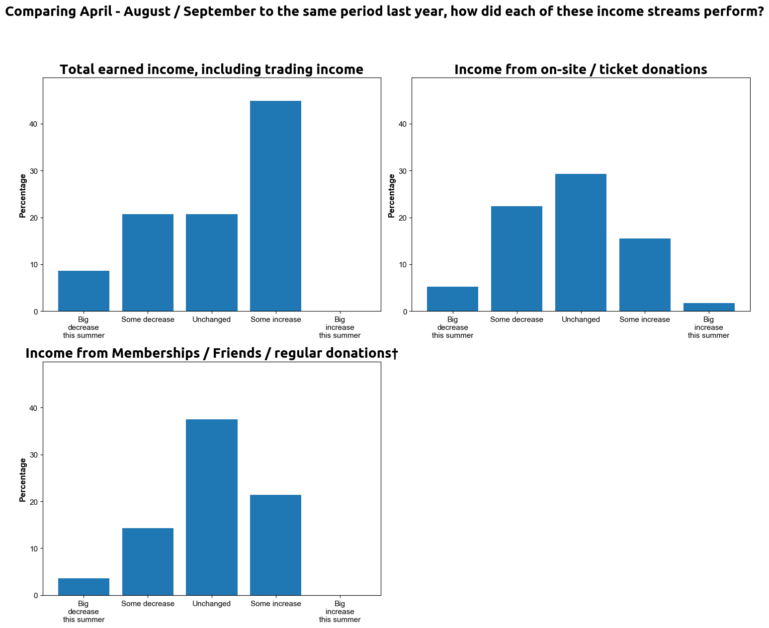
† Excluding major gifts / Trusts & Foundations / grants etc.
n=58
When compared with 2023, panel members had polarising experiences regarding total demand, with more respondents seeing increases and decreases in 2024 than 2023.
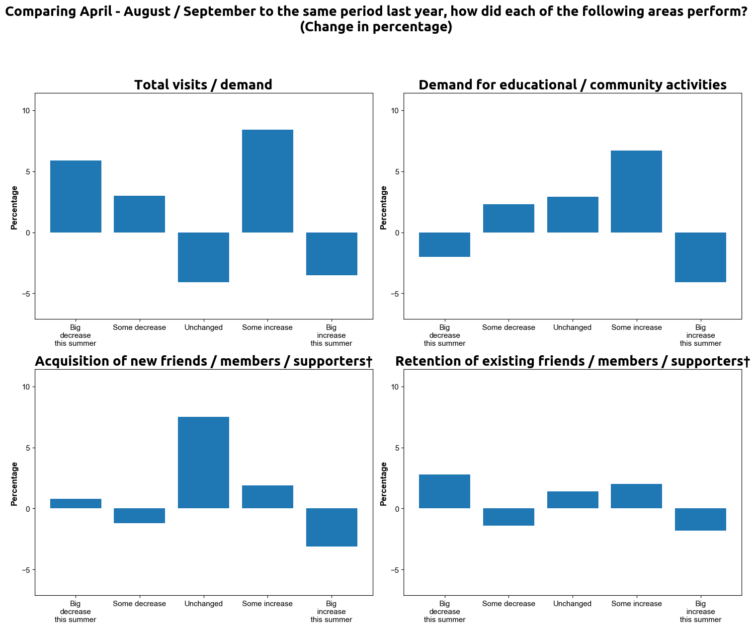
† Include annual pass-holders and other season ticket-holders if these are advertised as a way of supporting your work.
A mixed picture for memberships, and on-site donations
In terms of income, panel members saw smaller increases in income in 2024 than 2023, with a downward trend in income from on-site / ticket donations.
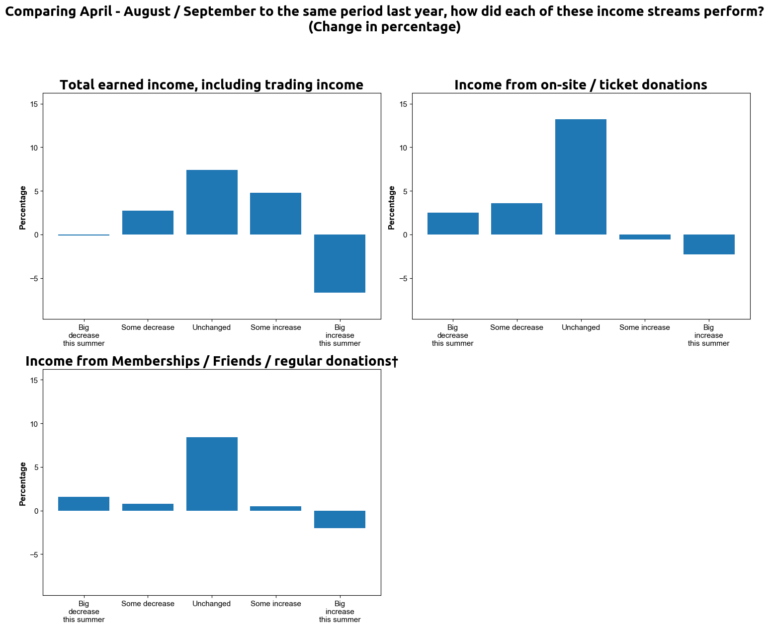
† Excluding major gifts / Trusts & Foundations / grants etc.
Signposts You can read the findings of the 2023 survey at heritagepulse.insights-alliance.com/updates/summer-2023-review/
Where poor weather posed a challenge to members, 50% identified a direct financial impact
To what extent did the weather present operational challenges for your organisation / venue this summer?
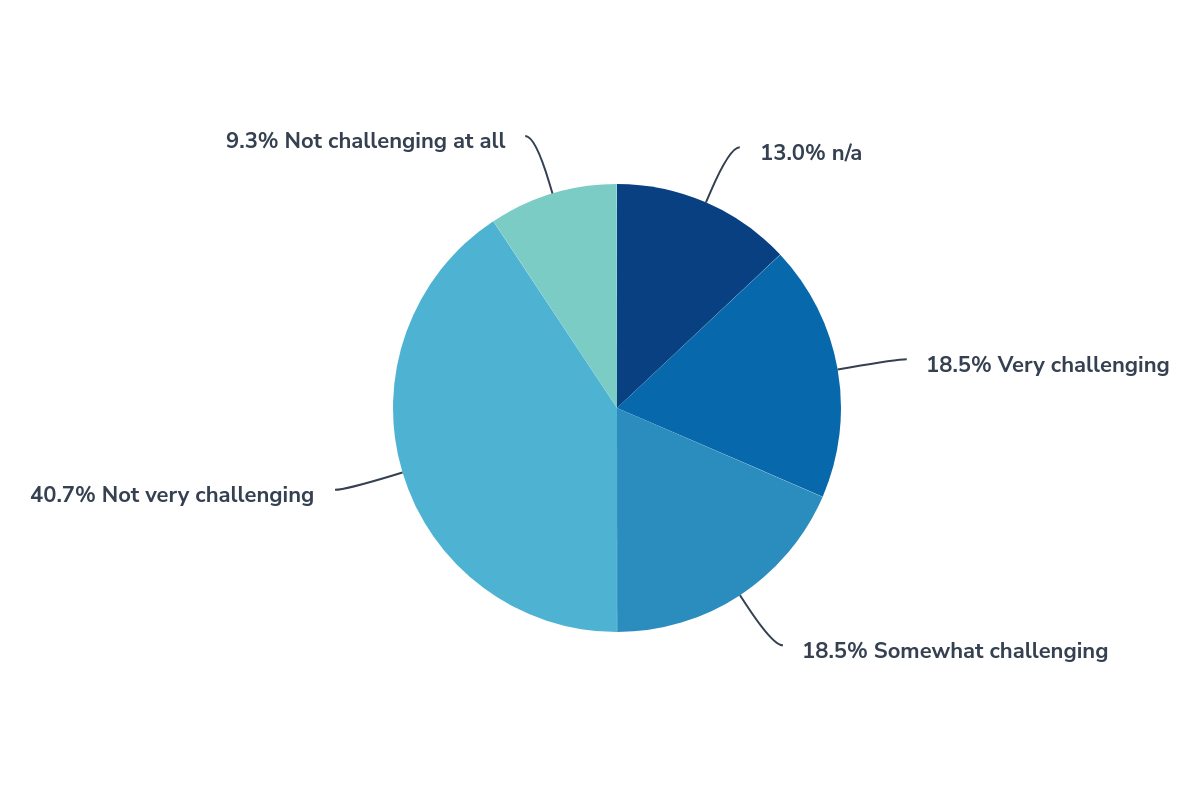
n = 54
More than one-in-three panel members said that the weather posed a somewhat or very challenging operational environment this summer. These panel members were prompted to explain this further in a free-text question. We used a Large-Language Model (LLM) to analyse the responses and categorise them into the following topics: environmental, financial and organisational.
| Environmental | 26% |
| Financial | 53% |
| Organisational | 21% |
n = 19
The financial impact manifested itself primarily through a decline in visitor numbers. Examples cited by panel members include:
“Poor weather means poor passenger loadings with all the impact on income streams.”
“Rain/wind etc. reduces our visitor numbers by a huge amount. [There] wasn’t really summer weather so fewer people visited.”
Read more
In the last 12 months, almost 30% of all travellers and over 40% of younger travellers have been put off travelling to a destination due to inclement weather. The full report from World Travel Market can be read here (free, registration required)
Examples of environmental challenges posed by the weather include:
“Wet days, waterlogged grassy areas.”
“We are an outdoor attraction. We had a very wet spring and a very gloomy/overcast summer. May was a washout.”
Examples of organisational challenges faced by respondents include:
“Visitor numbers were down due to the poor weather conditions making travel… impossible. It is also challenging to get any contractors over when the weather is so poor.”
“It extends the time it takes to do tasks, may require sites to close.”
Panel members identified successful events as a summer highlight
We asked respondents what went well for them and their organisation this summer, analysing and categorising the responses using a LLM.
| Successful events | 35.6% |
| Improved visitor experience | 17.8% |
| Recruited more volunteers | 11.1% |
| Greater demand for services/heritage | 8.9% |
| Improved infrastructure | 8.9% |
| Increased income | 6.7% |
| Successful marketing | 6.7% |
| Improved finance | 4.4% |
n = 45
Panel members described running successful events during the summer, and visitors responding positively to the experience they offered:
“Our big summer exhibition was great largely due to the enhanced family focus that we built into the offering.”
“We were involved in a dementia awareness activity, outside our museum, but were able to draw attention to what we do at the museum.”
“The museum felt very busy with a real buzz. This summer was the first time foreign visitors have returned in number since the pandemic.”
Other respondents identified successes with volunteer recruitment campaigns during the summer, and completing projects beneficial to the future of the organisation:
“Volunteer numbers remained high which met we are able to open on all advertised dates.”
“We completed on a major project on time and within budget.”
For peak season 2024, financial pressures and visitor numbers were the top challenges
Respondents were then asked what the biggest challenge they faced during the summer. Again, this was analysed and categorised using a LLM.
| Finance | 28.6% |
| Visitor numbers | 26.5% |
| Management | 18.4% |
| Weather | 16.3% |
| Volunteer numbers | 10.2% |
n = 49
Panel members identified increasing costs, falls in donations and inflation as financial pressures they faced during this period. Respondents also saw declining bookings and footfall leaving them unable to hit visitor targets:
“Overall we see less footfall and lower donations, possibly due to the economic climate. Having to run harder to stand still.”
“Budgets for work not rising in line with inflation – some areas have been static for 5 years and the work can no longer be done.”
“Reduction in school visits and open day visitors mainly due to economic downturn and rain in August.”
Pulse Monitor: Monthly confidence tracker
Pulse Monitor is a monthly health check on the heritage sector, measuring the resilience of both people and organisations.
Increasing confidence cost challenges can be managed
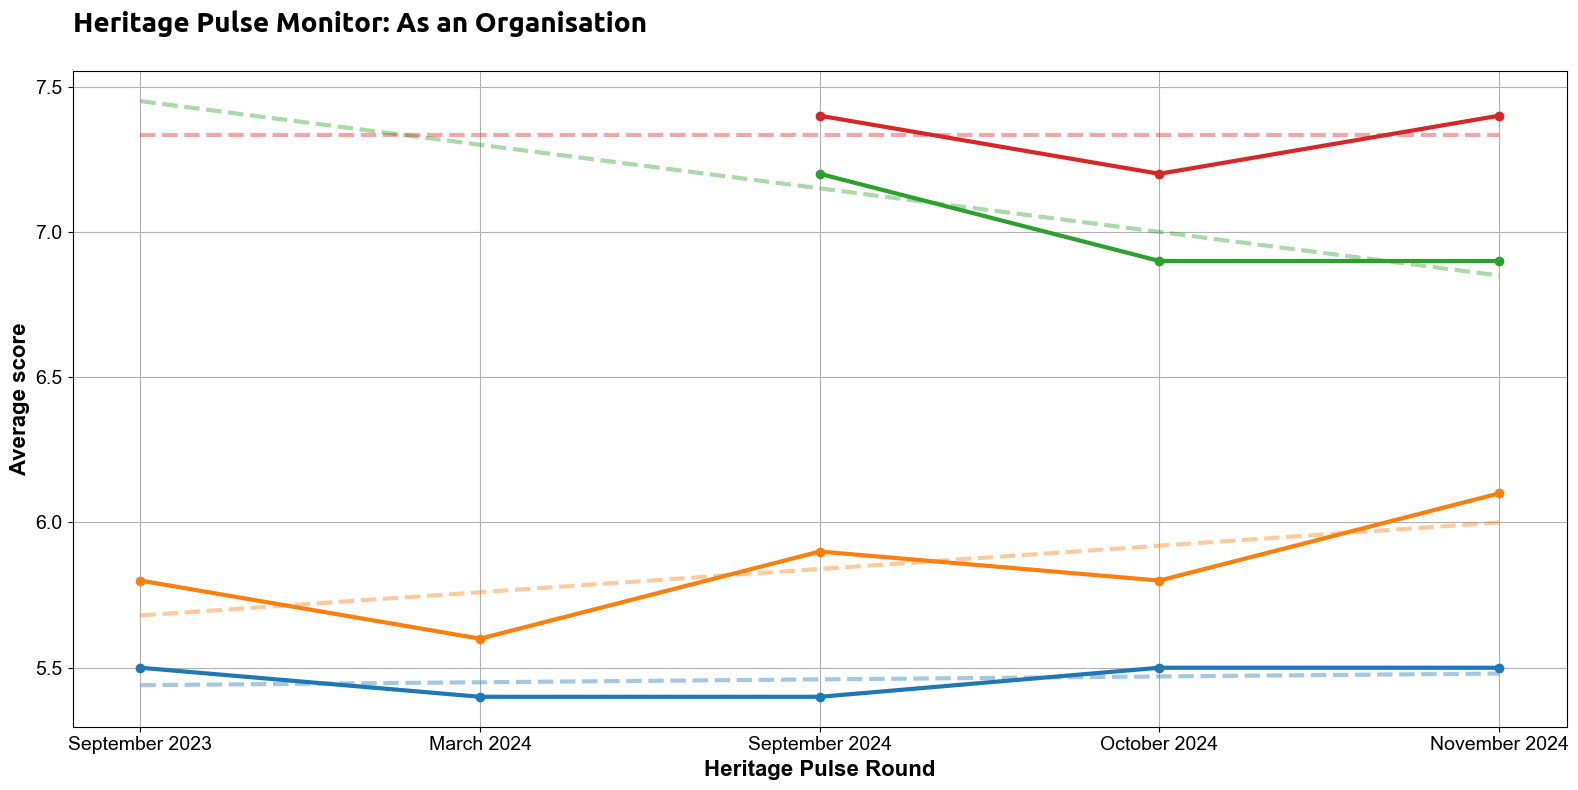

115 panel members completed this question.
The confidence of respondents in their ability to adapt to challenges around reduced income or increasing costs continues to trend upwards, going above 6 / 10 for the first time. Panel members’ ability to recruit and train new volunteers/staff as needed remains at 5.5 / 10.
Respondents’ confidence in their ability to survive the following 12 months remains flat (6.9 / 10), whereas panel members’ understanding of their objectives increased slightly this month from 7.2 to 7.4 / 10.
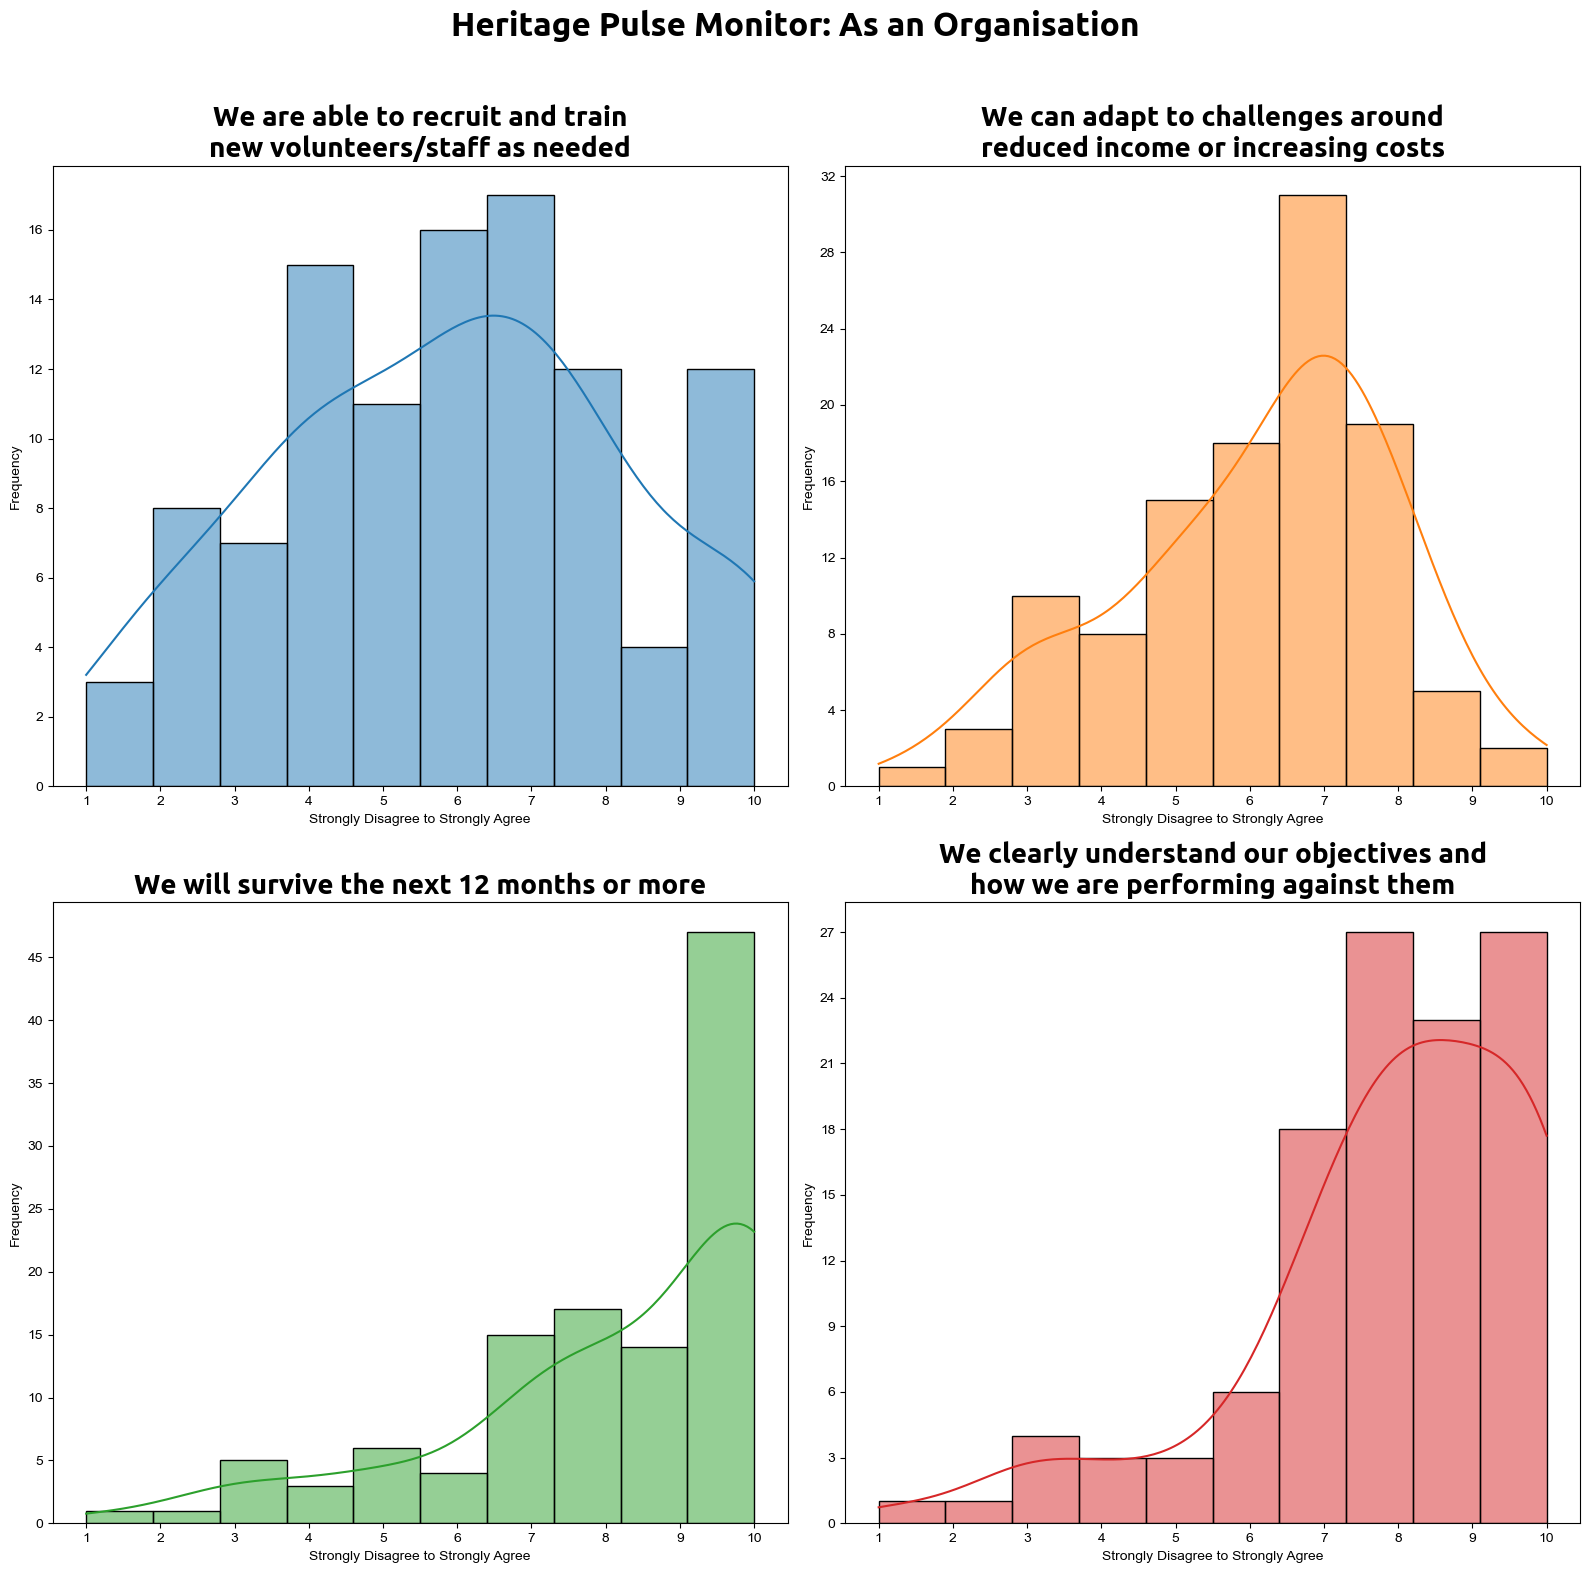
The most common response amongst panel members when asked about the coming 12 months is 10 / 10, and when asked about performance against objectives responses are skewed towards Strongly Agree.
There is a mixed set of responses when panel members are asked about their ability to retain and recruit staff. While this could reflect an uneven experience for different types of organisations, we should note the relatively small sample size makes it difficult to look at this further in this round.
Confidence in ability to care for heritage grows again
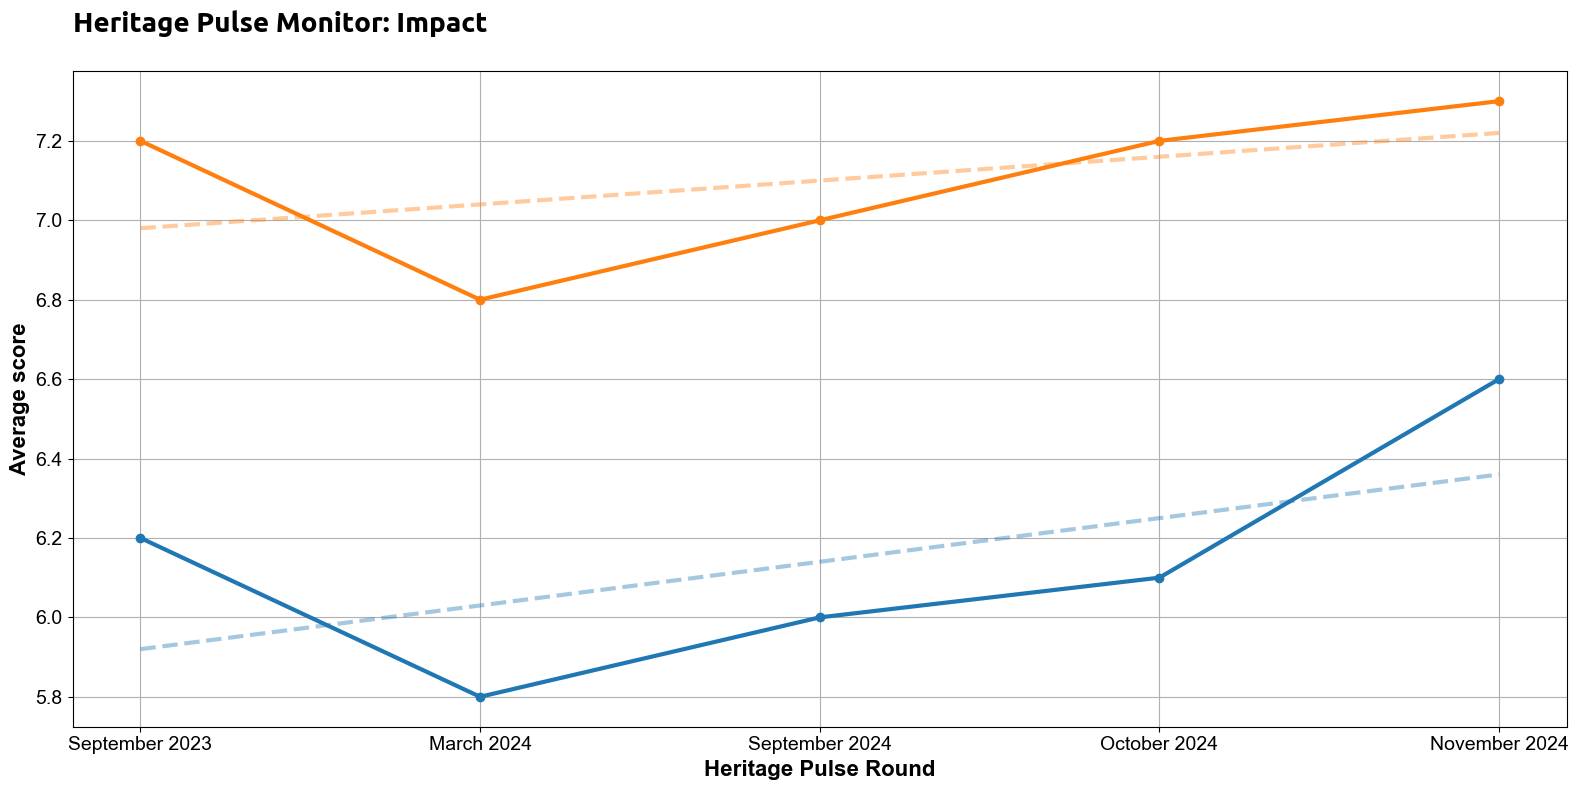

116 panel members completed this question.
Respondents’ belief that their organisation can adequately care for its collection / area of heritage increased by 8% to 6.6 / 10, ending the round at its highest point. The perception that organisations and the heritage they are responsible for is valued by their community grew slightly to 7.3 / 10, and is now above its September 2023 result.

When respondents were asked if the heritage they cared for was valued by their community, this question had the highest consensus amongst panel members as their responses were most closely clustered to the mean.
Indicators of personal resilience remain stable
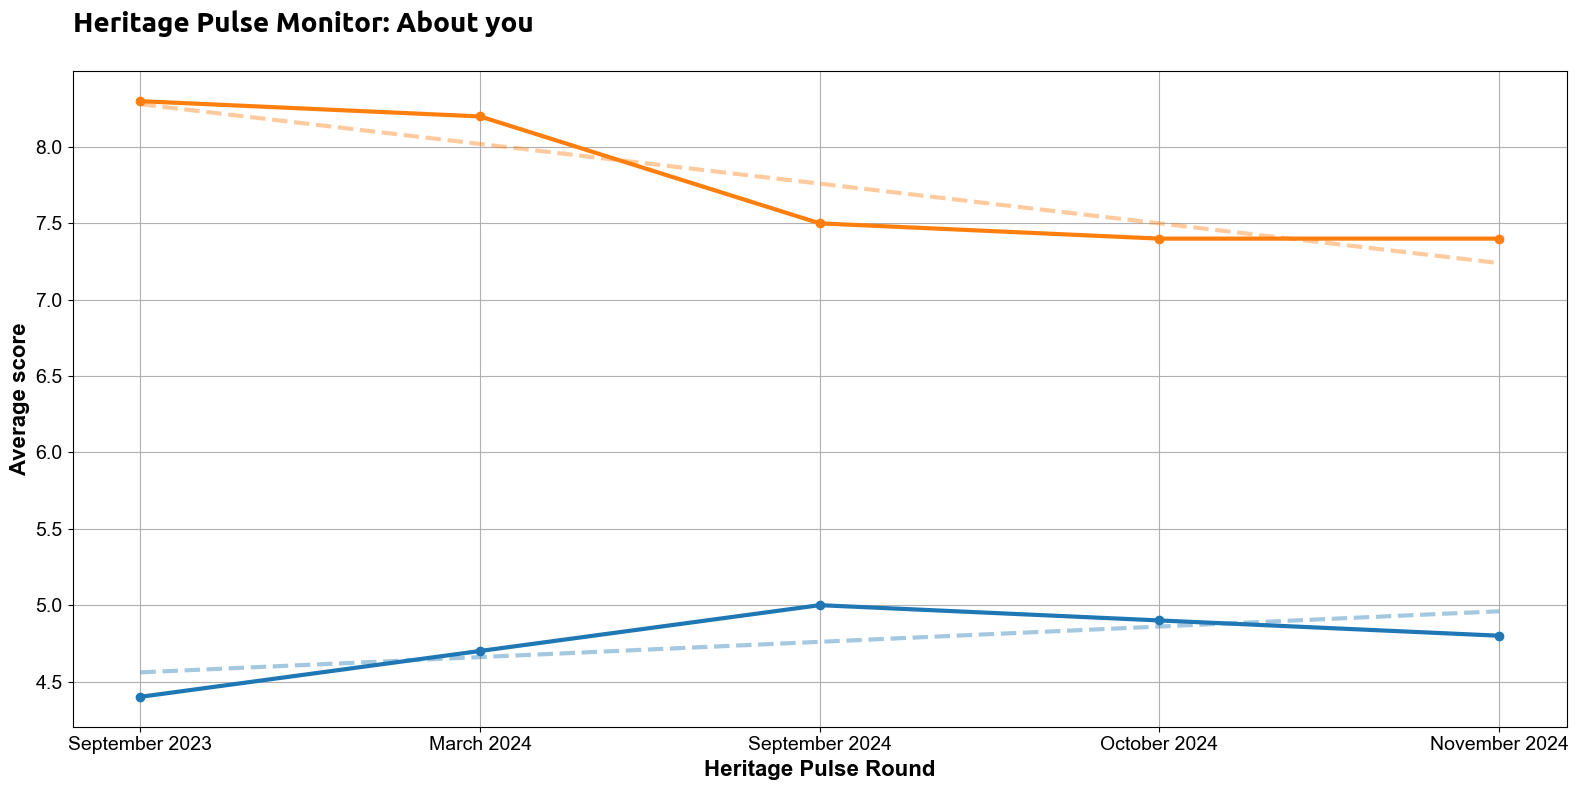

116 panel members completed this question.
Panel members’ hope to remain at their current organisation (7.4 / 10) and reported stress remained stable (4.8 / 10) on October 2024.
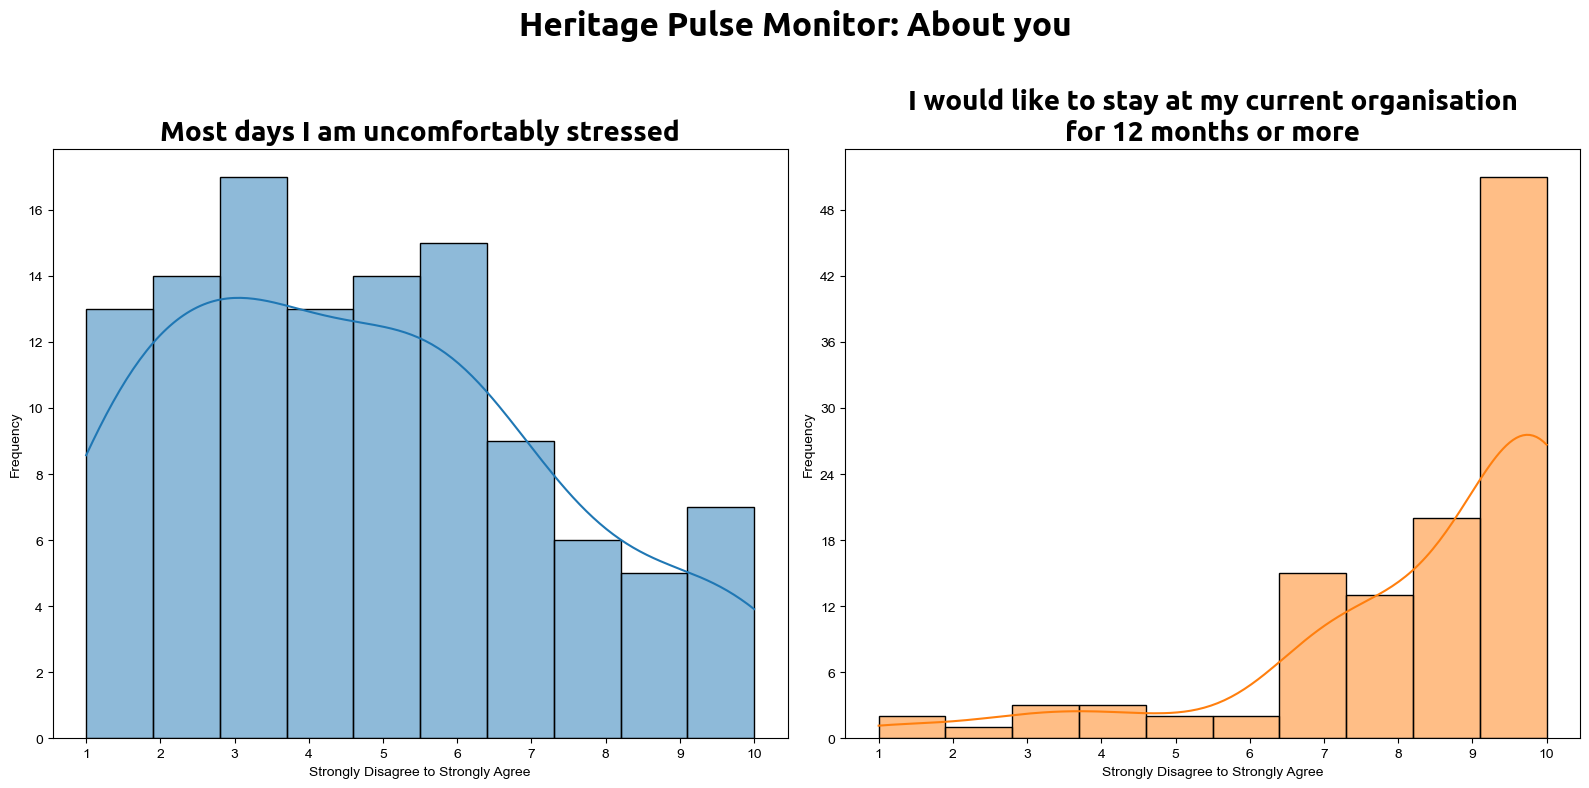
Panel members moderately disagree when considering reported stress, with their responses the most spread along the scale of any Pulse Monitor question. The most common answer from respondents when asked if they would like to stay at their current organisation for 12 months or more is 10 / 10, showing a positive outlook amongst a plurality of panel members.
How representative of the Heritage Pulse panel were the November 2024 respondents?
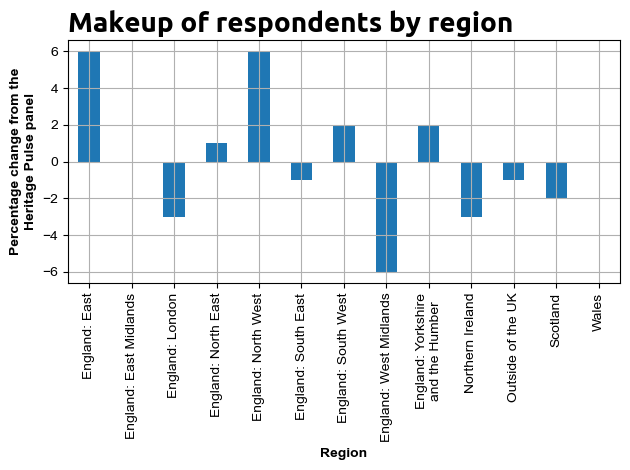
Due to the smaller sample size in this round, we saw greater regional variability in the makeup of respondents. The East and North West of England were overrepresented in the sample, with the West Midlands, London and Northern Ireland underrepresented.
Appendices
Reflections on Summer: Data Tables
Comparing April-September 2024 to the same period last year, how did each of the following areas perform?
| n/a | Big decrease this summer | Some decrease | Unchanged | Some increase | Big increase this summer | |
| Row % | Row % | Row % | Row % | Row % | Row % | |
| Total visits / demand | 11.5% | 11.5% | 14.8% | 16.4% | 42.6% | 3.3% |
| Demand for educational / community activities | 15.0% | 1.7% | 13.3% | 25.0% | 41.7% | 3.3% |
| Acquisition of new friends / members / supporters† | 18.3% | 3.3% | 10.0% | 31.7% | 36.7% | 0.00% |
| Retention of existing friends / members / supporters† | 17.2% | 3.4% | 12.1% | 51.7% | 15.5% | 0.00% |
† Include annual pass-holders and other season ticket-holders if these are advertised as a way of supporting your work.
n=61
Comparing April-September 2024 to the same period last year, how did each of these income streams perform?
| n/a | Big decrease this summer | Some decrease | Unchanged | Some increase | Big increase this summer | |
| Row % | Row % | Row % | Row % | Row % | Row % | |
| Total earned income, including trading income | 5.2% | 8.6% | 20.7% | 20.7% | 44.8% | 0.00% |
| Income from on-site / ticket donations | 25.9% | 5.2% | 22.4% | 29.3% | 15.5% | 1.7% |
| Income from Memberships / Friends / regular donations† | 23.2% | 3.6% | 14.3% | 37.5% | 21.4% | 0.00% |
† Excluding major gifts / Trusts & Foundations / grants etc.
n=58
Comparing April-September 2024 to the same period last year, how did each of these areas of expenditure change?
| n/a | Big decrease this summer | Some decrease | Unchanged | Some increase | Big increase this summer | |
| Row % | Row % | Row % | Row % | Row % | Row % | |
| Energy costs | 10.9% | 0% | 5.5% | 21.8% | 50.9% | 10.9% |
| Payroll | 24.1% | 0% | 0% | 31.5% | 33.3% | 11.1% |
| Other direct costs† | 3.6% | 0% | 1.8% | 20.0% | 67.3% | 7.3% |
| Other overheads†† | 5.5% | 1.8% | 0% | 21.8% | 65.5% | 5.5% |
† Direct costs vary based on demand / activity like materials
†† Overheads are fixed costs like insurance, IT costs etc.
n=55
