Thank you to the 291 UK Heritage Pulse panel members who responded to the February survey. The questions in this round related to organisational survival and the impact of rising costs, repeating questions previously asked between August and September 2022.
🔍 Click on any chart to zoom in.
Confidence in survival beyond six months has increased
Respondents were asked how confident they were that their organisation will survive up to three months, up to six months, and more than six months. Looking to the long term, 66% of respondents say they are very confident their organisation will survive beyond six months, which is up five points since the question was last asked in August / September 2022. 3% said they were “not at all confident” their organisation would survive.
How confident are you that your organisation will survive […more than six months]?
| 1 Not at all confident | 2 | 3 | 4 | 5 Very confident | |
|---|---|---|---|---|---|
| February 2023 (n. 270) | 3% | 4% | 14% | 13% | 66% |
| August/September 2022 (n.232) | 1% | 4% | 16% | 18% | 61% |
Overall, confidence of organisational survival is high in the short term, though in the previous round of research 92% reported that they were “very confident” their organisation would survive up to three months, and so paradoxically there has been a small decline in confidence in short term survival, alongside the increased confidence in long-term survival.

Confidence in financial forecasting consolidates

When asked “How confident are you that you can accurately predict the financial outlook for your organisation over the next 12 months?”, the most commonly chosen answer was four out of five, compared to three out of five in the previous round.
| 1 Not at all confident | 2 | 3 | 4 | 5 Very confident | |
|---|---|---|---|---|---|
| February 2023 (n. 270) | 6% | 12% | 33% | 35% | 14% |
| August / September 2022 (n.232) | 7% | 8% | 38% | 29% | 18% |
Confidence in visitor demand is mixed
42% of respondents report confidence in the range of one to three out of five this round, with 58% reporting confidence of four or five out of five.
The distribution (spread) of scores is consistent with the previous round in August / September 2022. Historic Buildings & Monuments split almost exactly 50/50 on whether they have low (1-3) or high (4-5) confidence in demand.

1: Not at All Confident – 5: Very Confident
| 1 Not at all confident | 2 | 3 | 4 | 5 Very confident | |
|---|---|---|---|---|---|
| February 2023 (n. 270) | 5% | 12% | 25% | 32% | 26% |
| August / September 2022 (n.232) | 5% | 11% | 24% | 35% | 25% |
Confidence in medium term investments is polarising
In the UK Heritage Pulse survey we ask “How likely are you to make medium term investments (in for example, Research & Development, maintenance, staff training) over the next 12 months?”. In this round, there is movement across the distribution, with a small increase in those who are very confident, but also increases in the respondents choosing one or two out of five. Smaller organisations are more hesitant than other respondents.
| 1 Not at all confident | 2 | 3 | 4 | 5 Very confident | |
|---|---|---|---|---|---|
| February 2023 (n. 247) | 12% | 19% | 25% | 26% | 18% |
| August / September 2022 (n.253) | 10% | 16% | 29% | 29% | 16% |
The sector may be attempting to absorb cost increases
The heat map below shows the distribution of responses to the question “How have the following areas changed for your organisation over the past 6 months?”. There are indications that while costs – including energy, other overheads and supplies – have risen significantly, prices charged by the sector have largely not changed, or only increased by a little. This may be because only small price increases are required, but there are indications instead that this is the result of hesitancy.
Unable to increase prices to match cost increases and the effect is a reduction in potential footfall.
We have not increased prices as this may have even more of a detrimental effect. Something is better than nothing. We have reduced some service and maintained those that have the best financial results.
With no conservation budget looking after our objects can be challenging but we manage with what we have. By far the cost of living crisis and the cost of utilities is our biggest challenge and is doubly hard with reducing income.
We’re a fixed term, fixed budget lottery project. Fortunately we had some cash in hand, but this will now go on inflation (esp salary inflation) rather than an extension as we had hoped. We’ve also adjusted emphasis to work with and support food banks which we weren’t before.
We’ve had to close our main activity site since October and can’t start operating again until next month when it starts to get warmer – just cannot afford to have heating on. Have of course seriously impacted on what we can deliver.
Key data
More than half of respondents indicated that the cost of salaries had increased in the past six months, with 59% expecting salaries to increase in the next six months also.
We paid staff pay awards at 4.6% last year and will struggle to maintain this going forwards on our annual budget. We have had a lot of difficulty recruiting staff over the last six months with insufficient applications which may be due to sector pay levels.

Cost increases anticipated
In the next six months, respondents are predominantly expecting costs to “increase a little” though just over a third expect costs to “increase a lot”
Just over half of respondents expect the prices they set to increase a little, while forecasting that demand will either not change, or increase a little.

Of the organisations expecting costs to “increase a lot”, they are more likely to manage historic buildings & monuments, landscapes & nature, or collections.

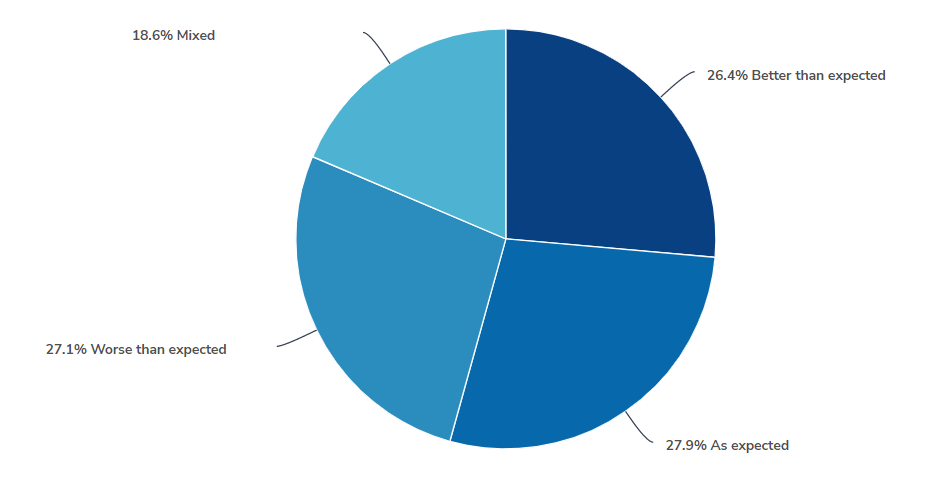
Did autumn and winter meet expectations?
Free-text responses to the question “Overall, how has autumn and winter been for your organisation so far, compared to your expectations?” were categorised, and there was an even distribution between worse than expected / as expected / better than expected / mixed.
This is perhaps an indication of the degree of instability in the external environment, making it more difficult for organisations to plan with accuracy. Organisations who responded with a ‘better than expected’ narrative were more likely to be Community Heritage or Historic Buildings and Monuments. Organisations responding ‘worse than expected’ were more likely to be Collections (Museums, Libraries & Archives), or those who care for Landscapes and Nature.
What is your reaction to these results? Please let us know at hello@insights-alliance.com, or share on social media with the hashtag #UKHeritagePulse
We want to hear from you
Would you be willing to share your advice on what makes for a successful partnership between two or more organisations, on camera? It takes 30 – 60 seconds and if you have a webcam or Smartphone, you can record it now.
We may share your clip when publishing future results.